circosJS
Circos 

Demo: nicgirault.github.io/circosJS/demo
table of contents
Introduction
Circos is a javascript library to easily build interactive graphs in a circular layout. It’s based on d3.js. It aims to be a javascript version of the Circos software.
You should consider using Circos to show:
- relationships between entities
- periodical data
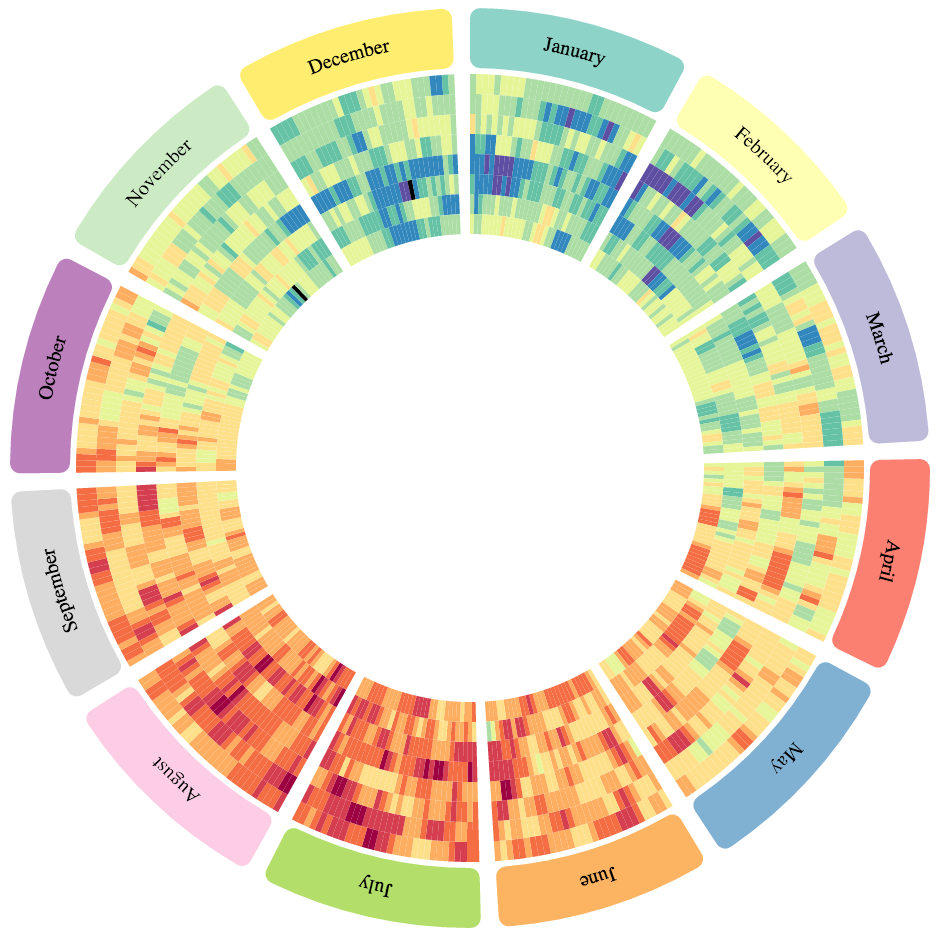
Average temperatures in Paris from 2007 (inner) to 2014 (outer). The circular layout highlights seasonal effect.
Installation
If you don’t know what is npm you can skip this step and get started with this canvas. Otherwise:
npm install --save circos
Layout
To instantiate a new circos:
var myCircos = new Circos({
    container: '#chart',
    width: 500,
    height: 500,
});
A circos graph is based on a circular axis layout. Data tracks appear inside and/or outside the circular layout.
In order to place data on the circos graph, you must first specify the layout.
myCircos.layout(data, configuration);
The first argument of the layout function is a configuration object that control the format of the layout.
Here are the default parameters for a layout:
var configuration = {
  innerRadius: 250,
  outerRadius: 300,
  cornerRadius: 10,
  gap: 0.04, // in radian
  labels: {
    display: true,
    position: 'center',
    size: '14px',
    color: '#000000',
    radialOffset: 20,
  },
  ticks: {
    display: true,
    color: 'grey',
    spacing: 10000000,
    labels: true,
    labelSpacing: 10,
    labelSuffix: 'Mb',
    labelDenominator: 1000000,
    labelDisplay0: true,
    labelSize: '10px',
    labelColor: '#000000',
    labelFont: 'default',
    majorSpacing: 5,
    size: {
      minor: 2,
      major: 5,
    }
  },
  events: {}
}
The second argument of the layout function is an array of data that describe the layout regions. Each layout region must have an id and a length. You can also specify a color and a label.
var data = [
  { len: 31, color: "#8dd3c7", label: "January", id: "january" },
  { len: 28, color: "#ffffb3", label: "February", id: "february" },
  { len: 31, color: "#bebada", label: "March", id: "march" },
  { len: 30, color: "#fb8072", label: "April", id: "april" },
  { len: 31, color: "#80b1d3", label: "May", id: "may" },
  { len: 30, color: "#fdb462", label: "June", id: "june" },
  { len: 31, color: "#b3de69", label: "July", id: "july" },
  { len: 31, color: "#fccde5", label: "August", id: "august" },
  { len: 30, color: "#d9d9d9", label: "September", id: "september" },
  { len: 31, color: "#bc80bd", label: "October", id: "october" },
  { len: 30, color: "#ccebc5", label: "November", id: "november" },
  { len: 31, color: "#ffed6f", label: "December", id: "december" }
]
The id parameter will be used to place data points on the layout.
To visualize the result:
myCircos.render();
Tracks
A track is a series of data points.
To add a track to your graph you should write something like this:
myCircos.heatmap(
    'my-heatmap',
    data,
    {
        // your heatmap configuration (optional)
    },
);
This pattern is similar to all track types:
myCircos.trackType('track-id', data, configuration);
Note: The track name is used as a HTML class name so here are the format limitations.
- Must be unique.
- Should be slug style for simplicity, consistency and compatibility. Example:
my-heatmap - Lowercase, a-z, can contain digits, 0-9, can contain dash or dot but not start/end with them.
- Consecutive dashes or dots not allowed.
- 50 characters or less.
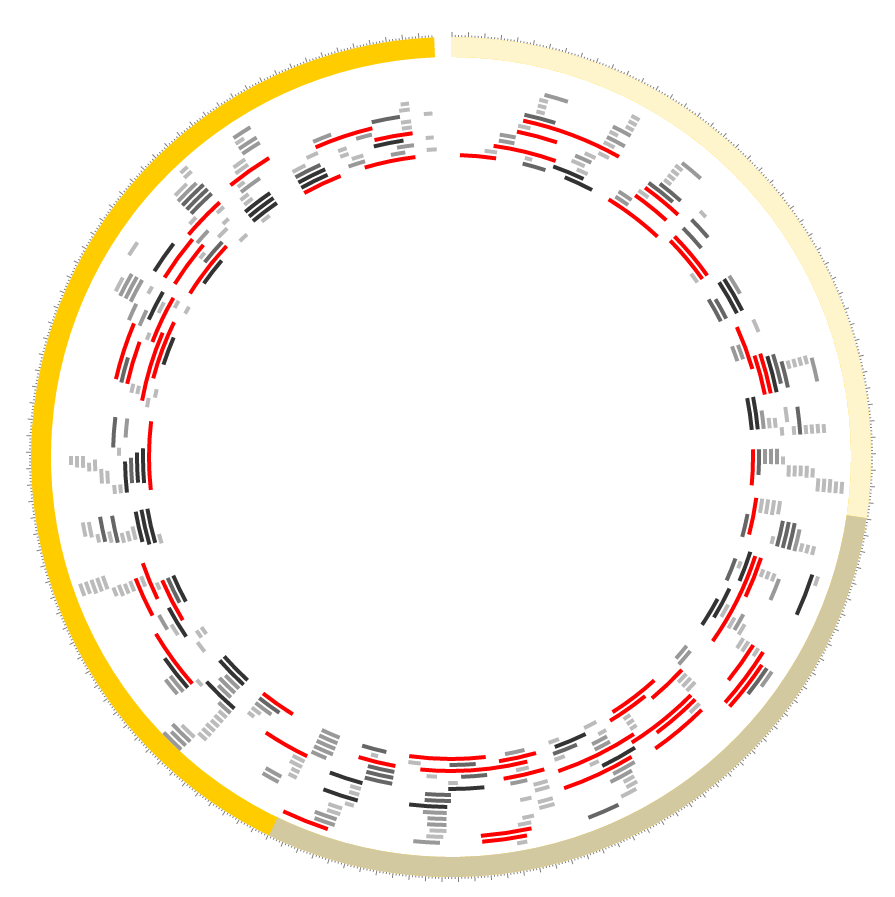
Chords
Chords tracks connect layout regions.
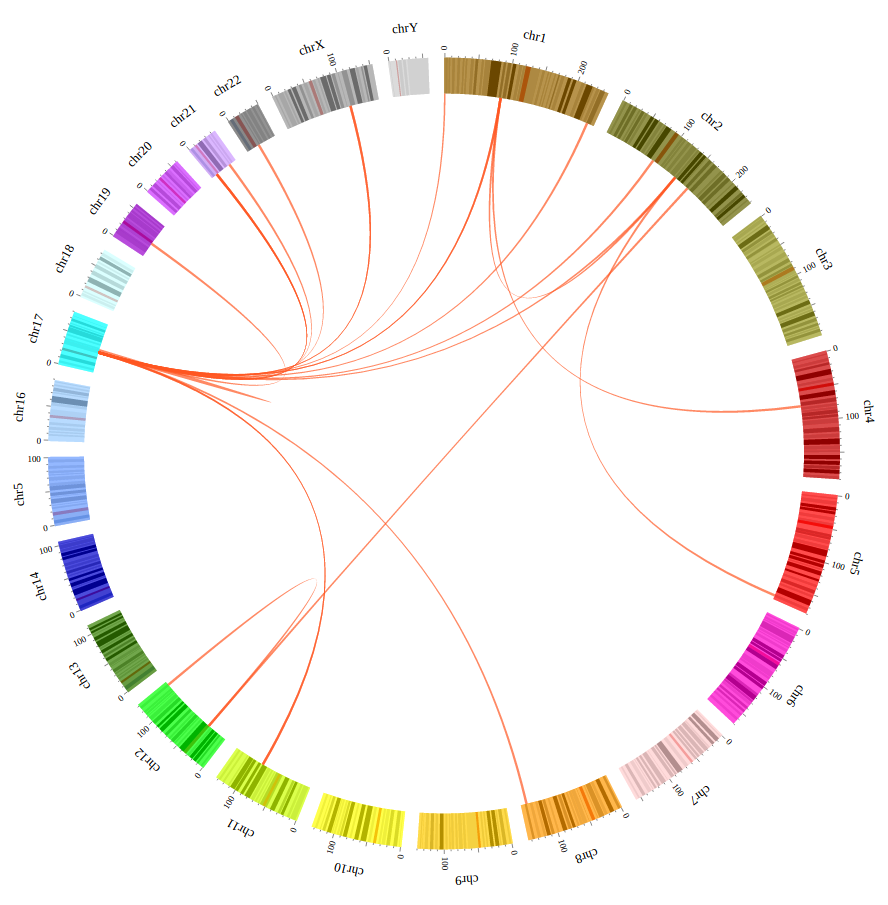
Some gene fusions in human karyotype (source)
Data should looks like this:
var data = [
  {
    source: {
      id: 'january',
      start: 1,
      end: 12
    },
    target: {
      id: 'april',
      start: 18,
      end: 20
    }
  },
  {
    source: {
      id: 'february',
      start: 20,
      end: 28
    },
    target: {
      id: 'december',
      start: 1,
      end: 13
    }
  },
  ...
];
Optionally each datum can define a value attribute to draw colored ribbons with palettes or a color function.
The available configuration fields are:
Heatmap
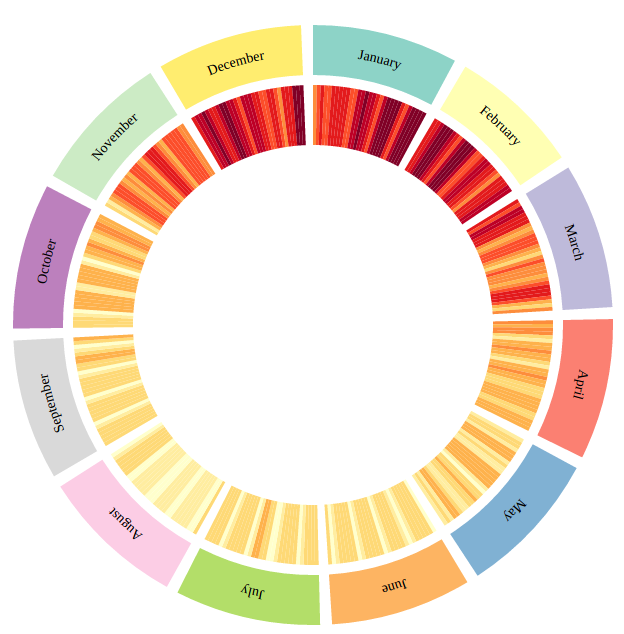
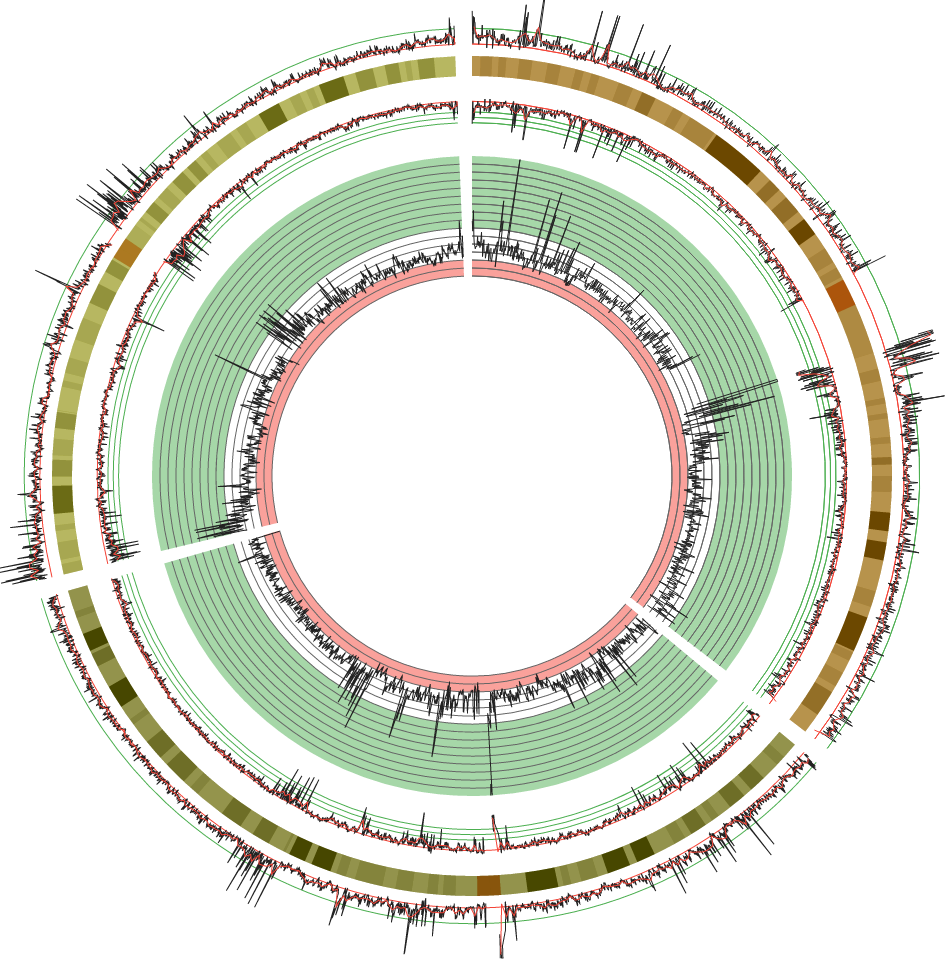
Electrical comsumption in France in 2014
To add a heatmap to your circos instance:
myCircos.heatmap('electrical-consumption', data, configuration);
Configuration:
{
  innerRadius: null,
  outerRadius: null,
  min: null,
  max: null,
  color: 'YlGnBu',
  logScale: false,
  tooltipContent: null,
  events: {}
}
Data format:
var data = [
  {
    block_id: 'january',
    start: 0,
    end: 1,
    value: 1368001
  },
  {
    block_id: 'january',
    start: 1,
    end: 2,
    value: 1458583
  },
  ...
]
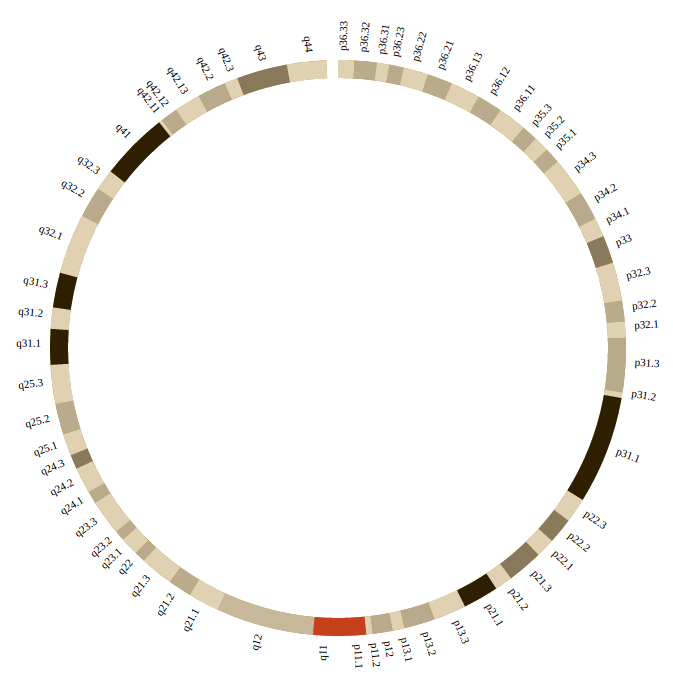
Highlight
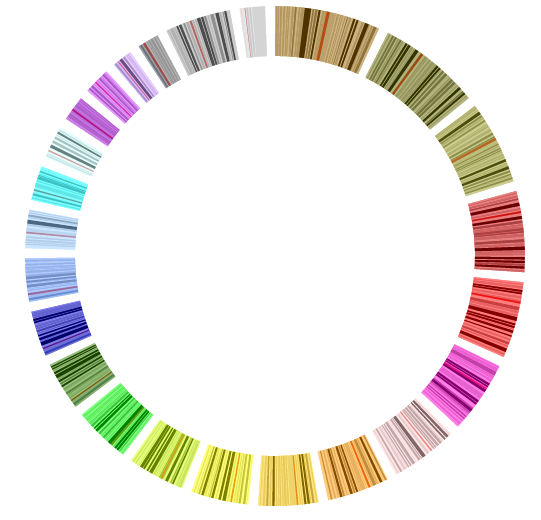
Human karyotype with cytobands highlighted (source)
To add a highlight to your circos instance:
myCircos.highlight('cytobands', data, configuration);
The minimal datum should have block_id, start and end attributes.
Configuration:
{
  innerRadius: null,
  outerRadius: null,
  min: null,
  max: null,
  color: 'd3d3d3',
  strokeColor: null,
  strokeWidth: 0,
  opacity: 1,
  logScale: false,
  tooltipContent: null,
  events: {}
}
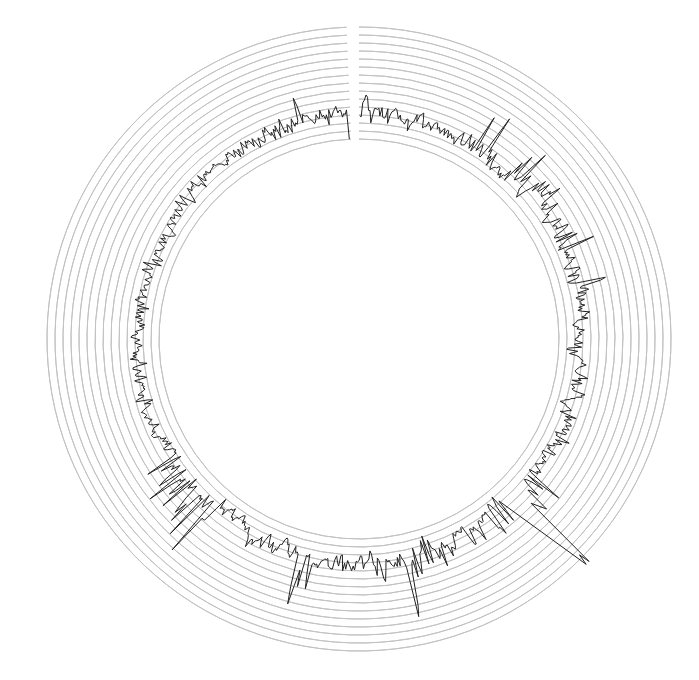
Histogram
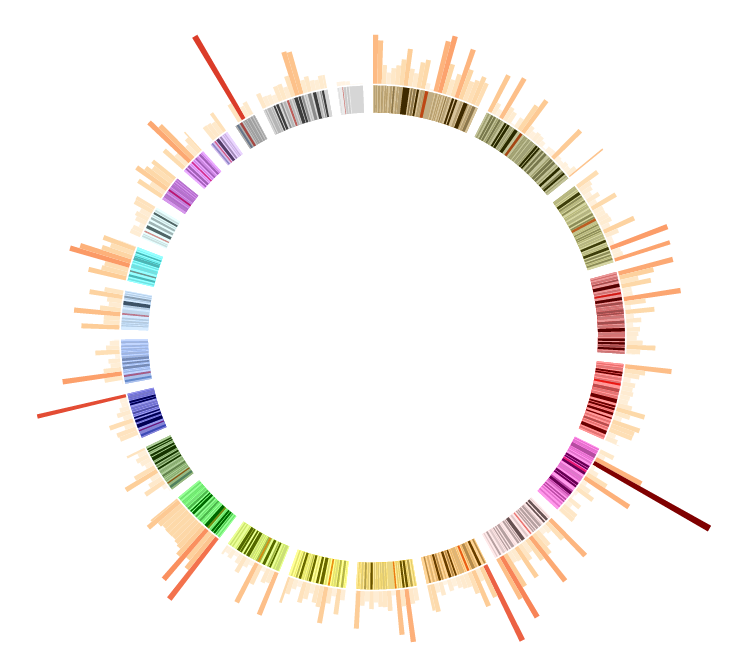
Genetic abnormalities in human stem cells (source)
Data should looks like this:
var data = [
    {
      block_id: 'january',
      start: 1,
      end: 10,
      value: 5
    }
];
The available configuration fields are:
- innerRadius
- outerRadius
- color
- opacity
- zIndex
- tooltipContent
- min
- max
- logScale
- logScaleBase
- axes
- events
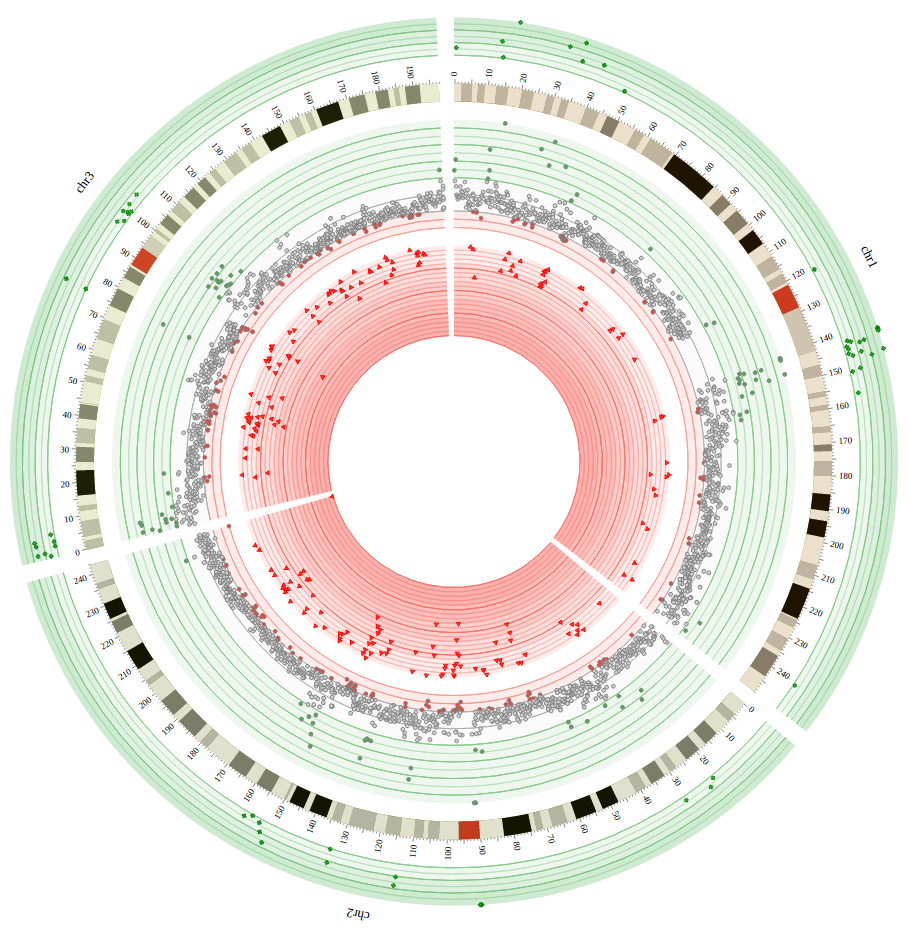
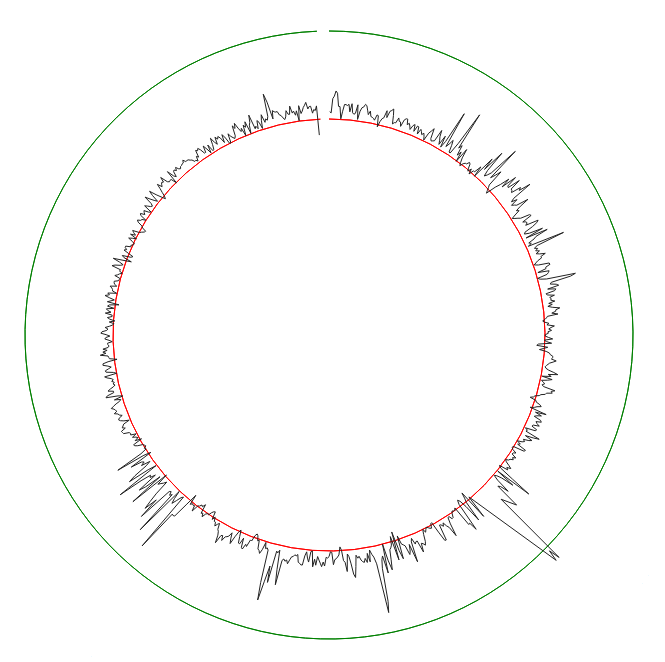
Line
Some single nucleotide polymorphism on chromosomes 1, 2 and 3 (source)
myCircos.line('line1', data, configuration);
The minimal datum should have block_id, position and value attributes (see above tracks for more details).
The available configuration fields are:
- innerRadius
- outerRadius
- color
- strokeColor
- strokeWidth
- direction
- fill
- fillColor
- maxGap
- opacity
- zIndex
- min
- max
- logScale
- logScaleBase
- axes
- backgrounds
- events
Note: The tooltip option is not available for line track. To display a tooltip, you should superimpose an invisble scatter track (fill: false and strokeWidth: 0) and set a tooltip for this track.
Scatter
myCircos.scatter('scatter1', data, configuration);
The minimal datum should have block_id, position and value attributes (see above tracks for more details).
The available configuration fields are:
- innerRadius
- outerRadius
- color
- strokeColor
- strokeWidth
- direction
- fill
- size
- shape
- opacity
- zIndex
- min
- max
- logScale
- logScaleBase
- axes
- backgrounds
- events
Stack
myCircos.stack('stack', data, configuration);
The minimal datum should have block_id, start and end attributes (see above tracks for more details).
Configuration:
{
  innerRadius: null,
  outerRadius: null,
  min: null,
  max: null,
  color: '#fd6a62',
  strokeColor: '#d3d3d3',
  strokeWidth: 1,
  direction: 'out',
  thickness: 10,
  radialMargin: 2,
  margin: 2,
  opacity: 1,
  logScale: false,
  tooltipContent: null,
  events: {}
}
Text
myCircos.text('text', data, configuration);
The minimal datum should have block_id, position and value attributes (see above tracks for more details).
Configuration:
{
  innerRadius: null,
  outerRadius: null,
  style: {
    'font-size': 12,
    fill: 'black',
    opacity: 1,
  },
  events: {}
}
Configuration Attributes
backgrounds
You can add a list of backgrounds:
{
  backgrounds: [
    {
      start: 0.006,
      color: '#4caf50',
      opacity: 0.1
    },
    {
      start: 0.002,
      end: 0.006,
      color: '#d3d3d3',
      opacity: 0.1
    },
    {
      end: 0.002,
      color: '#f44336',
      opacity: 0.1
    }
  ]
}
The start and end fields are interpreted as values on the same scale than the track values.
- If
startis not specified, default is theminvalue of the track. - If
endis not specified, default is themaxvalue of the track.
You can also specify a color and an opacity.
events
All tracks and the layout configurations can receive an events attribute. This attribute must be an object where keys are event names and values are event callbacks. For example:
{
  events: {
    'click.alert': function (datum, index, nodes, event) {
      window.alert(datum)
    }
  }
}
The documentation about d3 events is here. You can add all events described in this documentation. I recommend using event namespaces (click.alert instead of click) to avoid possible conflicts with internal circosjs events.
innerRadius/outerRadius
For the layout, the innerRadius and outerRadius values are always interpreted as a number of pixel.
For tracks:
If innerRadius and outerRadius are between 0 and 1, the value is interpreted as a fraction of the innerRadius of the layout.
eg:
{
  innerRadius: 0.5,
  outerRadius: 0.8
}
If innerRadius and outerRadius are between 1 and 10, the value is interpreted as a fraction of the outerRadius of the layout.
eg:
{
  innerRadius: 1,
  outerRadius: 1.2
}
Otherwise it is interpreted as a number of pixels.
min/max
The default min and max values are computed according to the dataset. You can override these values by specifying a min or max attribute in the configuration.
color
The color attribute can be either:
CSS color code
e.g #d3d3d3, blue, rgb(0, 0, 0)
Palette name from d3-scale-chromatic
The color will be computed dynamically according to the track data value field.
If you prefix the palette name with a - (e.g -BrBG), the palette will be reversed.
The list of palette names are:
BrBG:
![]() PRGn:
PRGn:
![]() PiYG:
PiYG:
![]() PuOr:
PuOr:
![]() RdBu:
RdBu:
![]() RdGy:
RdGy:
![]() RdYlBu:
RdYlBu:
![]() RdYlGn:
RdYlGn:
![]() Spectral:
Spectral:
![]() Blues:
Blues:
![]() Greens:
Greens:
![]() Greys:
Greys:
![]() Oranges:
Oranges:
![]() Purples:
Purples:
![]() Reds:
Reds:
![]() BuGn:
BuGn:
![]() BuPu:
BuPu:
![]() GnBu:
GnBu:
![]() OrRd:
OrRd:
![]() PuBuGn:
PuBuGn:
![]() PuBu:
PuBu:
![]() PuRd:
PuRd:
![]() RdPu:
RdPu:
![]() YlGnBu:
YlGnBu:
![]() YlGn:
YlGn:
![]() YlOrBr:
YlOrBr:
![]() YlOrRd:
YlOrRd:
![]()
Custom function
You can specify a function that compute the color code given the track data and the datum index. For example:
{
  color: function(datum, index) {
    return datum.value < 5 ? 'red' : 'green'
  }
}
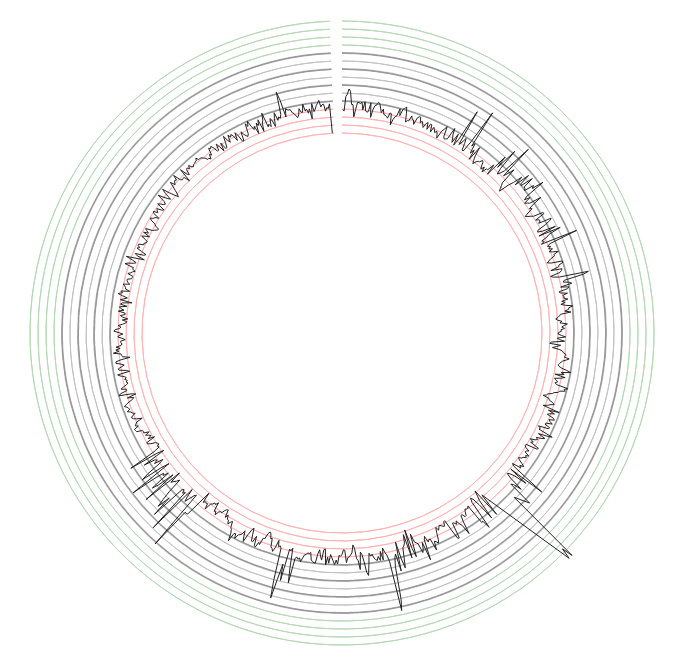
axes
The default value is an empty array:
{
  axes: []
}
You can add items to this array to render an axis or a group of axes. You can give axes a color (default: ‘#d3d3d3’), thickness (default: 1) and opacity (default: track opacity):
{
  axes: [
    {
      color: 'black',
      thickness: 2, // in pixel
      opacity: 0.3 // between 0 and 1
    }
  ]
}
Then you should specify where to place the axes.
You can either define a single axis by defining a position attribute with a value between the min and max value of the track:
{
  axes: [
    {
      color: 'red',
      position: 4
    },
    {
      color: 'green',
      position: 15
    }
  ]
}
Or define a range of axes with a spacing attribute and optionnally a start and end attributes:
{
  axes: [
    {
      spacing: 2
    }
  ]
}
Here is an advanced example:
{
  axes: [
    {
      color: 'red',
      spacing: 2,
      end: 4
    },
    {
      color: 'green',
      spacing: 2,
      start: 16
    },
    {
      spacing: 2,
      start: 4,
      end: 16,
      thickness: 2
    },
    {
      spacing: 1,
      start: 4,
      end: 16,
      thickness: 1
    }
  ]
}
The values that you set for position, spacing, start and end are in the unit of the track values.
tooltipContent
A function that receive the datum and the index as a value and return a string displayed in the tooltip (HTML is accepted):
{
  tooltipContent: function (datum, index) {
    return `<h5>${datum.block_id}:${datum.start}-${datum.end} ➤ ${datum.value}</h5> <i>(CTRL+C to copy to clipboard)</i>`
  }
}
Then when you mouseover the datum, a tooltip will be displayed. Note that you can use the keyboard shortcut CTRL+C to copy the content to clipboard.
showAxesTooltip
Show or not a tooltip with the value of the axis. Default is true.
direction
It should be either in or out. Default is out. For stack you can also use center.
fill
true or false.
fillColor
A color such as #d3d3d3, red, rgb(112, 255, 1).
logScale
true or false. Default is false.
logScaleBase
The log base if logScale is true. Default is Math.E.
radius
In the chords configuration you can specify a radius parameter. Default is null.
Examples:
// when there is no value, default is null:
// the radius will be the one of the innerRadius of the layout
{}

// when the value is a number greater than 1, it is interpreted as
// a number of pixel from the center
{
  radius: 200
}

// when the value is a number lower than 1, it is interpreted as
// a fraction of the layout inner radius
{
  radius: 0.8
}

// you can also specify a function that return a number that
// will be interpreted as explained above. The function takes
// a datum as parameter
{
  radius: function (d) {
    if (d.source.id === 'chr1') {
      return 0.8
    }
    if (d.source.id === 'chr2') {
      return 0.7
    }
  }
}
shape
It should be one of:
circlecrossdiamondsquaretrianglestarwye
zIndex
This should be an integer. The higher it is the more above the track will appear.
Contact
Nicolas Girault nic.girault@gmail.com
Your feedbacks are welcome. If you’re struggling using the librairy, the best way to ask questions is to use the Github issues so that they are shared with everybody.